 The Learning Cave
Part (a)
Approach
The product moment correlation coefficient measures the strength of a linear relationship. For (ii) and (iii) we need patterns that are not simply “more scatter” versions of a straight line: (ii) needs a clear non-linear pattern with zero net linear trend, and (iii) needs a positive linear trend with enough scatter to pull below 1 but not below 0.5.
Part (i)
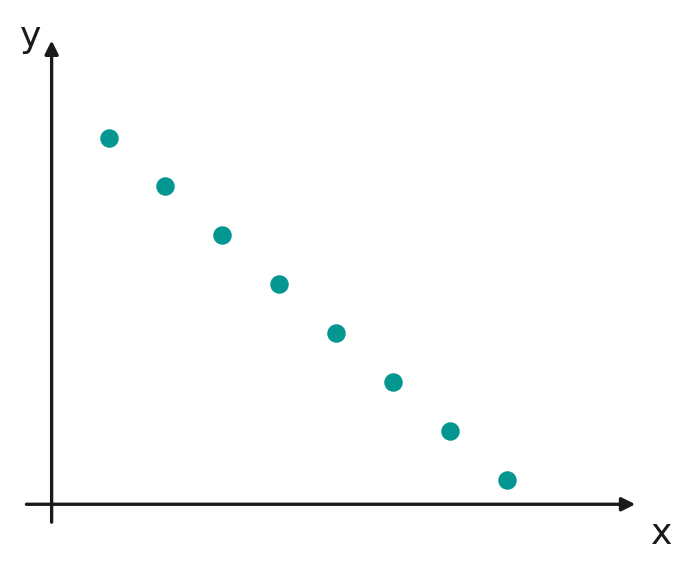
: eight points lying exactly on a straight line of negative gradient.
Part (ii)
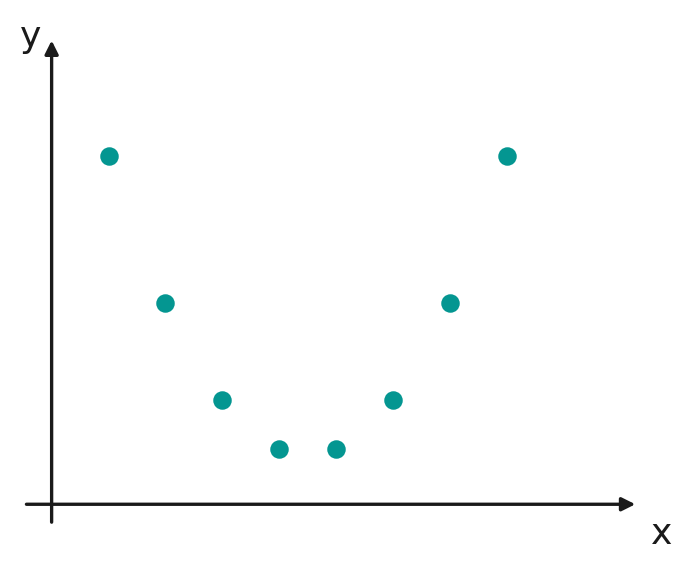
: eight points in a symmetric curved (non-linear) pattern, so that increases in are matched equally by increases and decreases in , giving no net linear trend.
Part (iii)
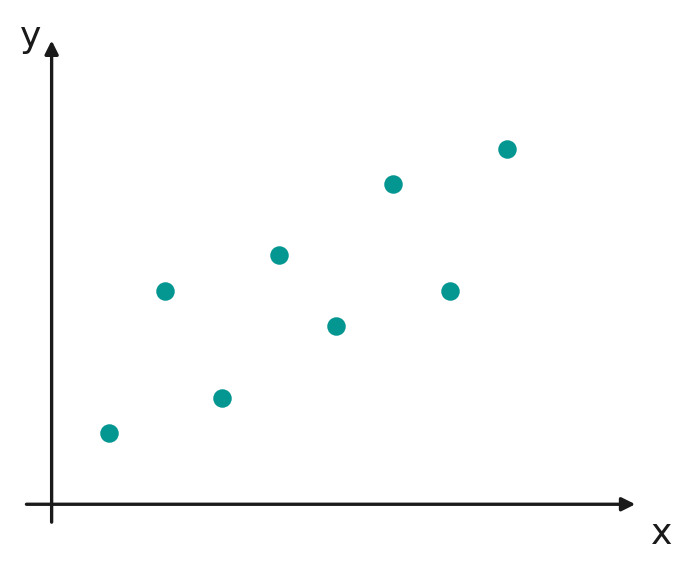
: eight points showing a clear increasing trend, but with enough scatter about the underlying line that the fit is not near-perfect.
Part (b)
Part (i)
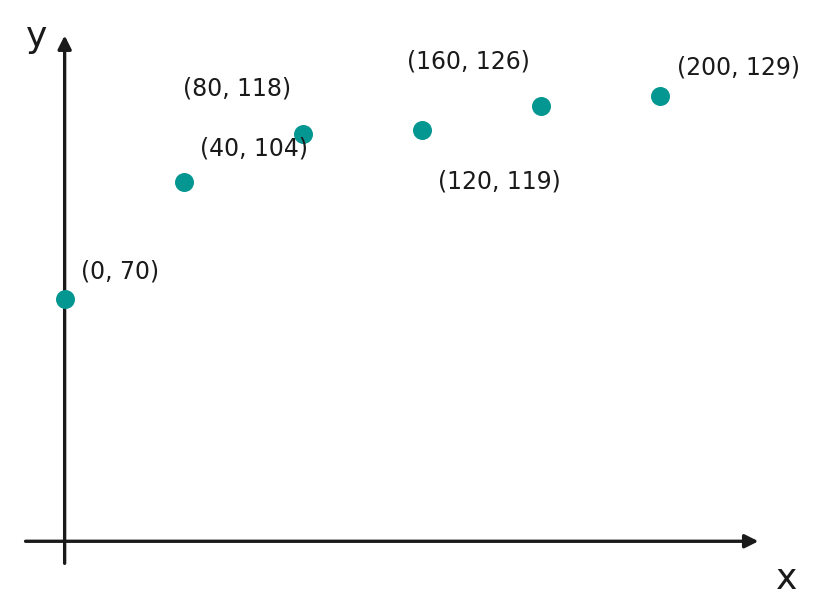
The scatter diagram shows increasing with , but at a decreasing rate, levelling off as grows, with no sign of turning downward.
Note: is one of the given data points. Models (B) and (C) are both undefined at , so neither can represent this data set at all. This leaves (A) and (D) to compare.
By GC, the product moment correlation coefficients for the two remaining linearised models are
Since is much closer to , and would be increasing at an increasing rate (the opposite of the levelling-off pattern seen), model (D) provides the most accurate model.
Part (ii)
Using model (D) with and as given, by GC (linear regression of on ),
The product moment correlation coefficient for this model is
Part (iii)
- lies within the range of the given data (), so this is interpolation, not extrapolation, which is more reliable.
- The product moment correlation coefficient is close to , showing a strong linear relationship between and , so the model fits the data well.